Goal the first: Python and pandas
My Python experience is a bit like my Spanish. I know a couple of basic phrases, I can find the restroom, and I can click “See Translation” online. In other words, this goal is definitely going to be a learning experience.
This was the first goal I set out to accomplish because it also served as the data cleansing and profiling stage. Once I knew the data was good, I knew I could replicate the analysis across different tools. I created a field mapping to track info for each of the 56 fields:
- Intended data type
- Null handling (in this case, ‘null’ was the actual field value)
- Trim extra whitespace
- Analyzed vs. Not-analyzed string in Elasticsearch
- Included in the convert filter in my Logstash config
To help with the data profiling I used the free Trifacta Wrangler for Individuals, which really helped track down the data types and fields with ‘null.'
Shifting to a Python and pandas mindset for performing the data import and data cleansing was definitely more of a challenge than I anticipated. I’m not talking about days or weeks but 20 or 30 minutes here and there staring at the screen wondering why it’s not doing what I think it should. Despite these challenges and a less forgiving experience than my SQL Server and DTS/SSIS knowledge, I started to think about possible uses for the flexibility and power that this approach provided. In other words, the more time I spent troubleshooting and using pandas, the more I appreciated it.
I primarily leaned most heavily on these resources during my Python and pandas meanderings:
- Wes McKinney’s book, “Python for Data Analysis” http://shop.oreilly.com/product/0636920023784.do
- http://pandas.pydata.org/pandas-docs/stable/comparison_with_sql.html# — this page was a great accelerator for the simplest aspects of converting SQL to pandas
- http://www.dataschool.io/best-python-pandas-resources/ — a good list of introductory pandas resources
Here's the code I used and the output of the .describe() function, showing the correction recalculation. (The code is an export from the Jupyter Notebook file I used.)
# In[1]:

from datetime import datetime
import pandas as pd
import numpy as np


# In[2]:

#Read in pitch data
#Include only certain columns to limit size
df = pd.read_csv('<location of file>', parse_dates=True, usecols=['game_date', 'tfs_zulu', 'player_name', 'release_spin_rate', 'pitch_type', 'pitch_id', 'sv_id', 'game_type', 'events', 'description', 'type', 'effective_speed', 'balls', 'strikes', 'outs_when_up'])


# In[3]:

#Modify records with value of 'null' as an actual string as opposed to NaN
df['release_spin_rate'].replace('null','NaN',inplace=True)
df['effective_speed'].replace('null','NaN',inplace=True)


# In[4]:

#Remove trailing whitespace
df['game_type'] = df['game_type'].str.strip()
df['pitch_type'].str[:2]

#Convert to datetime
df['tfs_zulu'] = pd.to_datetime(df['tfs_zulu'])
df['game_date'] = pd.to_datetime(df['game_date'])

#Convert to numeric
df['release_spin_rate'] = df['release_spin_rate'].astype(float)
df['effective_speed'] = df['effective_speed'].astype(float)


# In[5]:

#Confirm data types
df.count()


# In[6]:

#Select records for Carl Edwards, Jr.
result = df[df['player_name'] == 'Carl Edwards Jr.']

#Select pitch types for "Fastballs"
#Select only records with release_spin_rate > 0
#Select only regular season games
result = result[(result.pitch_type.isin(["FF", "FC", "FS", "FT"])) & (result['release_spin_rate']>0) & (result.game_type ==  'R')]
result.describe()

#mean for release_spin_rate should be 2659 to match the @darenw link
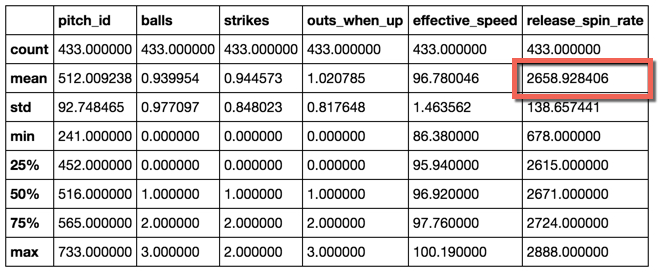
Output of the pandas .describe() function